KISTERS datasphere, your smart environmental data hub.
Environmental intelligence, connected and simplified in an intuitive and flexible, cloud-based platform.

See more than data. Understand it. Act on it.
KISTERS datasphere brings past, present, and forecasted data from multiple sources into one intuitive cloud platform — so you can see more, understand faster, act with confidence. Track water levels. Monitor sensor networks. Compare sites. No coding. No installs. No rigid tools. No paying for modules you do not need. Just smart insights — from day one, and ready to grow with you.
Download the brochureAll your data. One platform.
A top-ranked data-agnostic platform.
Unlike other platforms, KISTERS datasphere isn’t limited to a specific discipline. Its data-agnostic design allows integration of any continuous data type. Bring together sensor feeds, third-party data, and forecast layers.
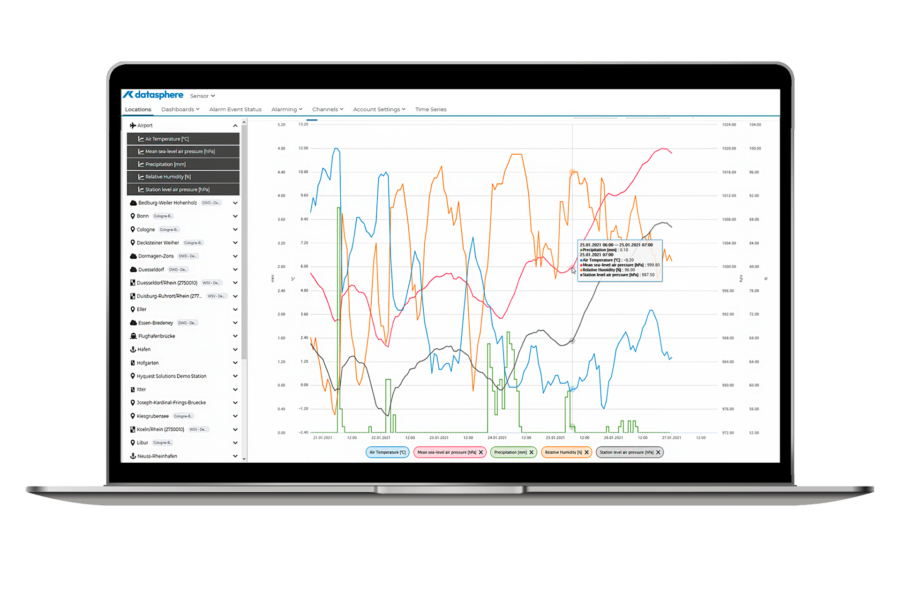
Full-spectrum visualization.
Make better decisions faster.
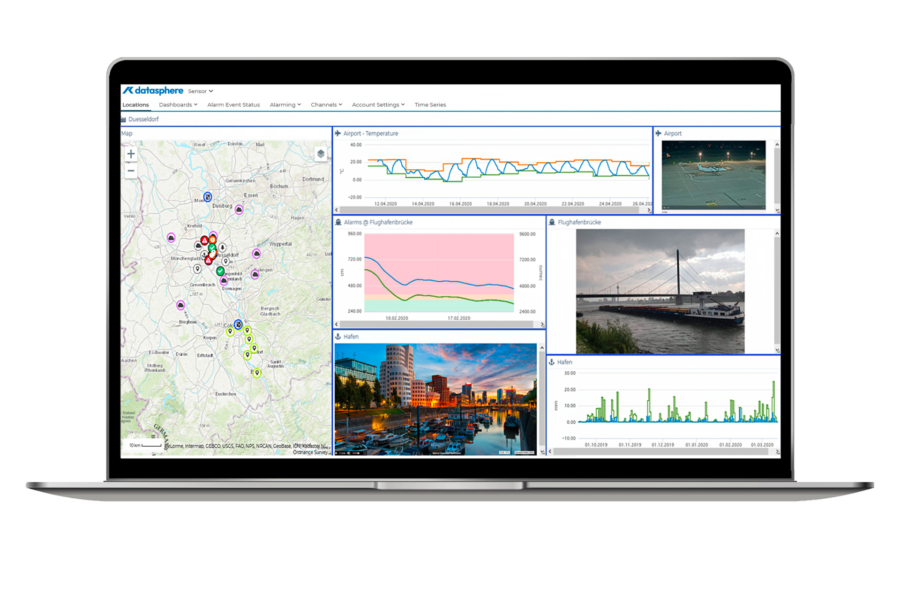
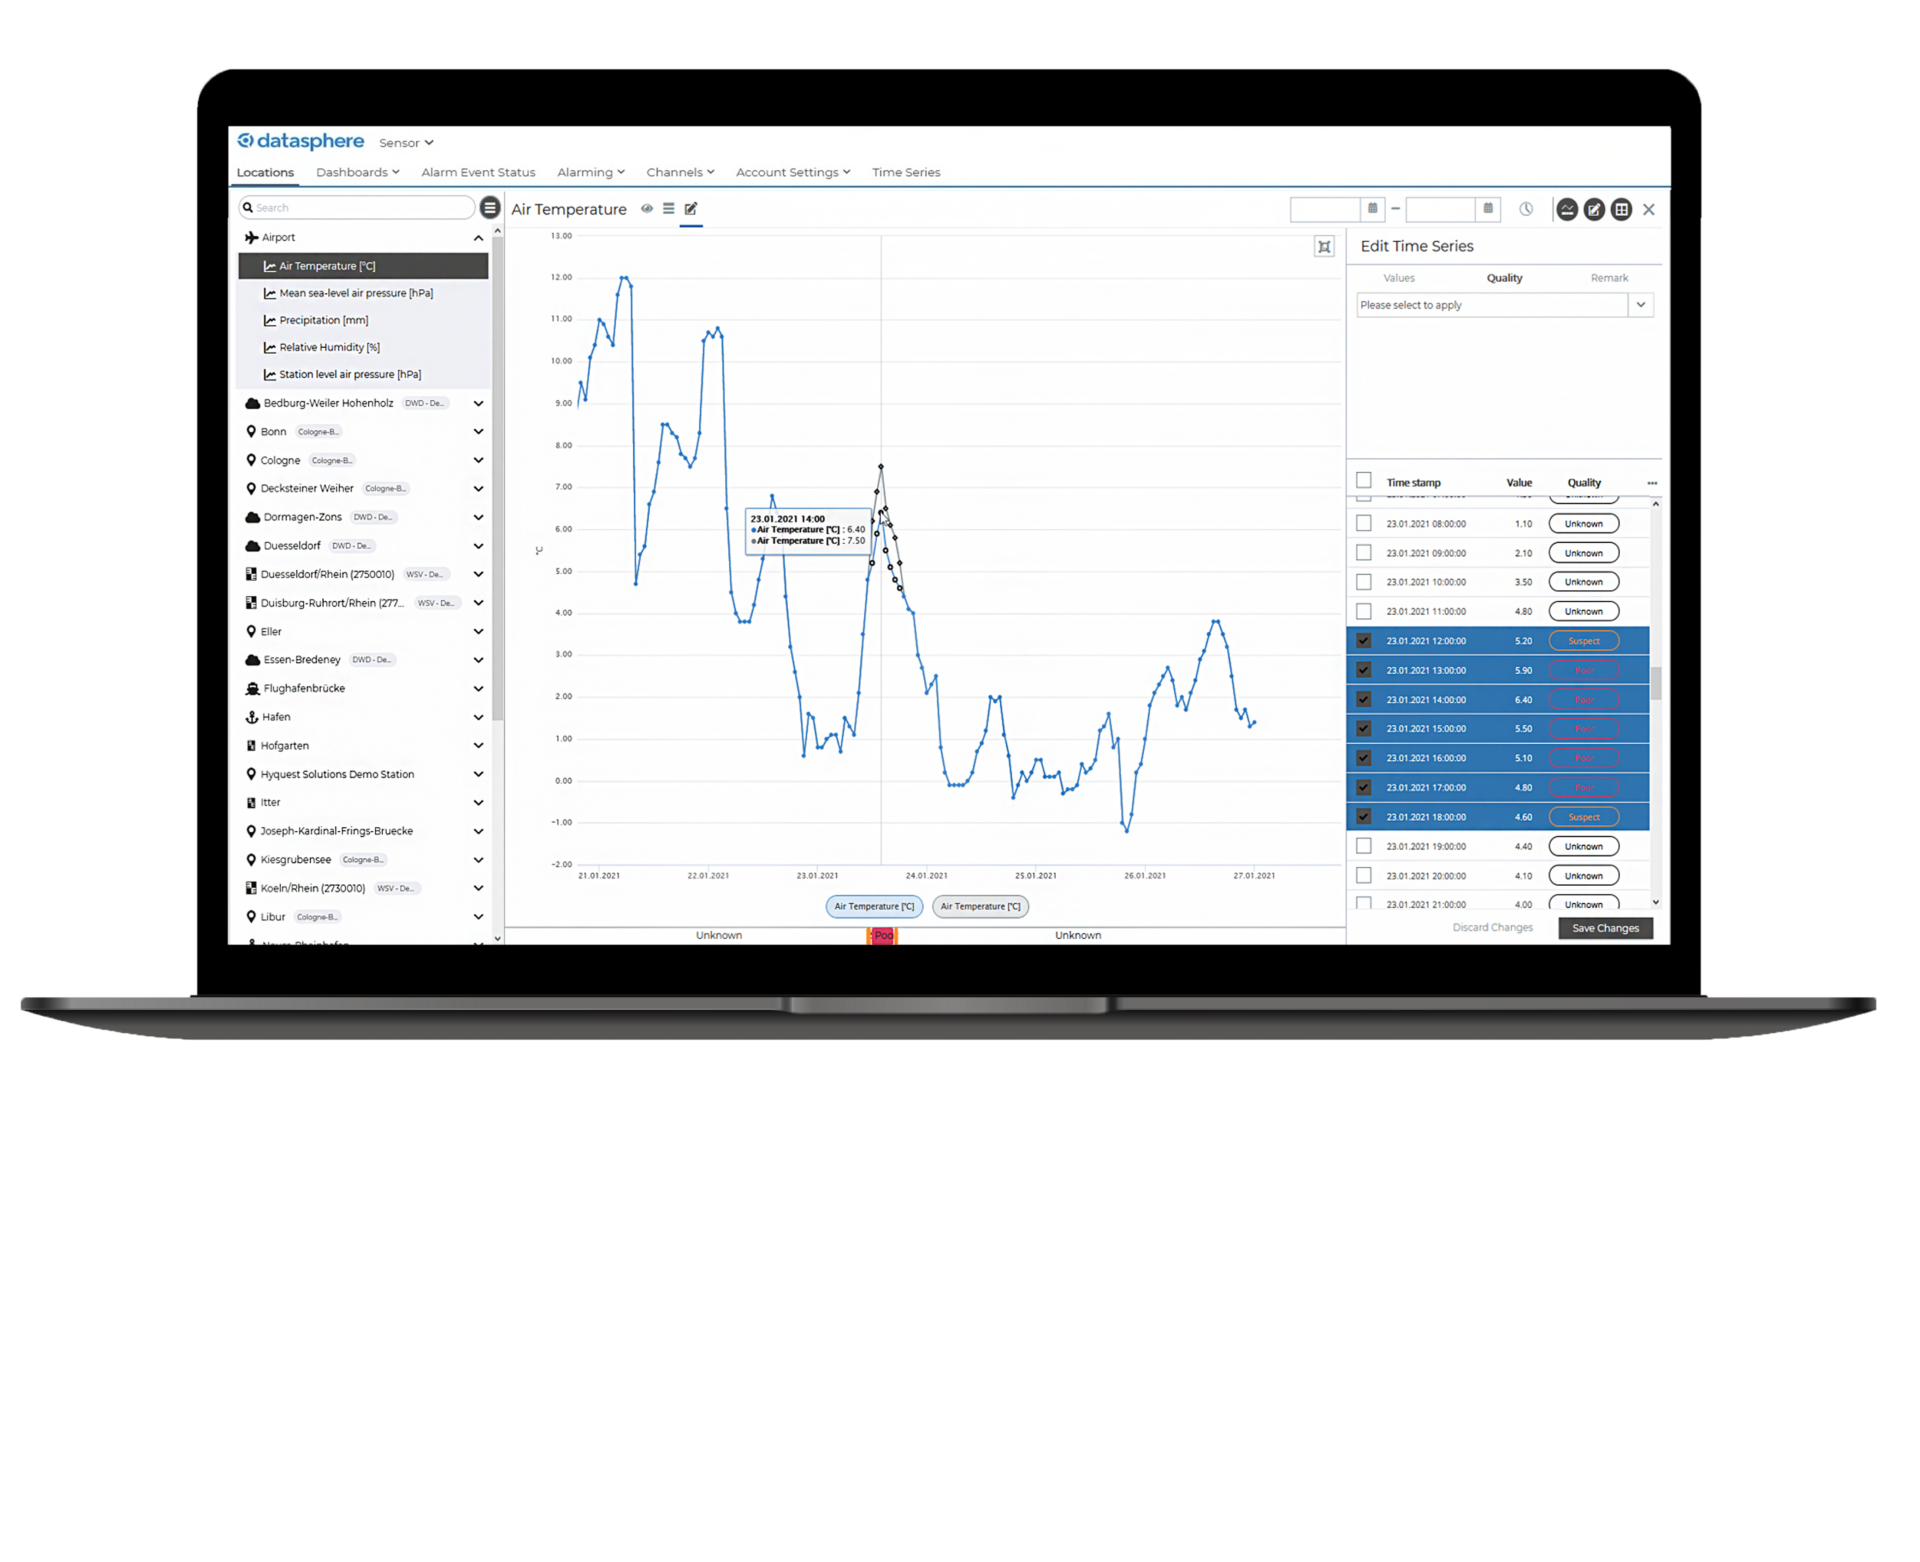
Go beyond line graphs. Use comparative, real-time, and customizable vizualisation tools— from GIS map views and dashboards, to forecast overlays and trend analysis. Get station-level access, overlay multiple data series in a single graph (i.e. rainfall data with level data, or forecast data with sensor data) and access recent and historical data all at once.
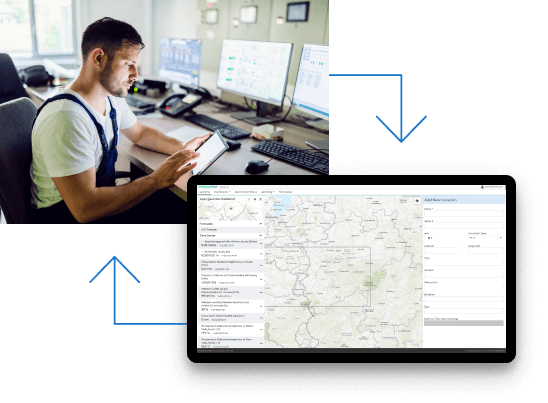
Identify emerging issues.
Act before issues escalate.
Logging, reporting, and alerting are fully automated. Set threshold-based alarms and receive notifications via email, SMS, your preferred messaging app– or integrate with SCADA. Intuitive red-yellow-green indicators show risk levels at a glance, helping teams prepare to act early. Whether in the field or office, everyone gets the views they need.
Modular & no-code architecture.
Want to do more?
All tools are built for operational teams — no coding needed. Unlock advanced modules only when needed, with no upfront commitment. Set alarms, share data, automate via API, or add forecasting for hail, frost, floods, and more.
Learn more.


850+
Trusted by 850+ organisations across 30 countries, including governments, NGOs, private companies.
40000+
Capturing data in 40,000+ locations worldwide.
50000+
Access to 50,000+ unique time-series data in EMEA alone.
Key features.

KISTERS datasphere supports...
- Utilities and infrastructure operators
- Government and public agencies
- Environmental and research organizations
- Industrial operations
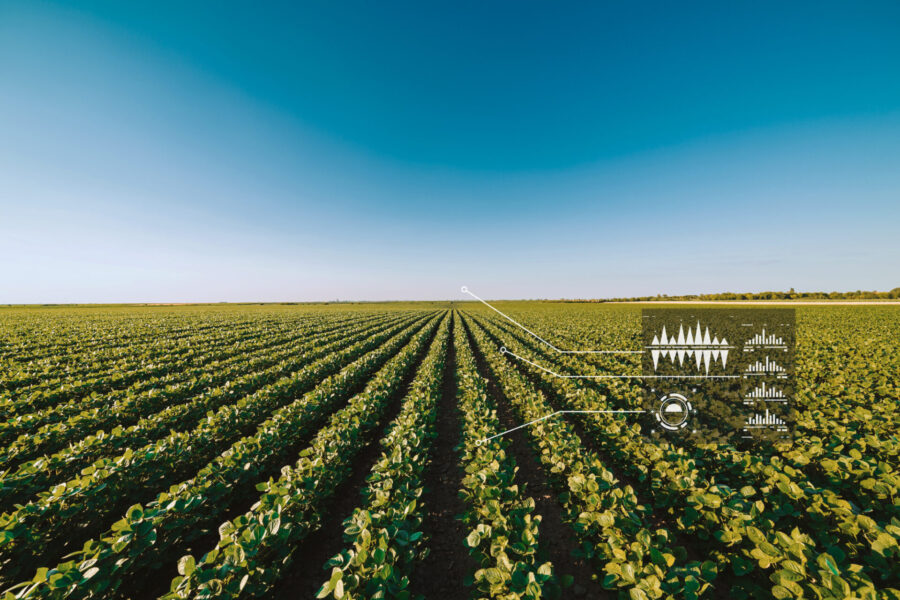
- Agriculture and irrigation management
- Emergency management and risk mitigation
Configured to your needs.
Our full range of extensions offer specific solutions to meet your needs and preferences. Arrange a consultation and we’ll identify a tailored solution for your organization.
Add-ons.
Get notified before conditions become critical – with threshold-based, real-time alerts.
With Advanced Alerting Module

Get notified before conditions become critical – with threshold-based, real-time alerts.
Advanced Alerting Module
- Works with any sensor or forecast data ingested into Datasphere
- Supports red-amber-green alert levels
- Thresholds easily configured by parameter or location
- Email notifications with flexible group delivery
- Optional module in KISTERS datasphere
Contact us for more information Watch a demo
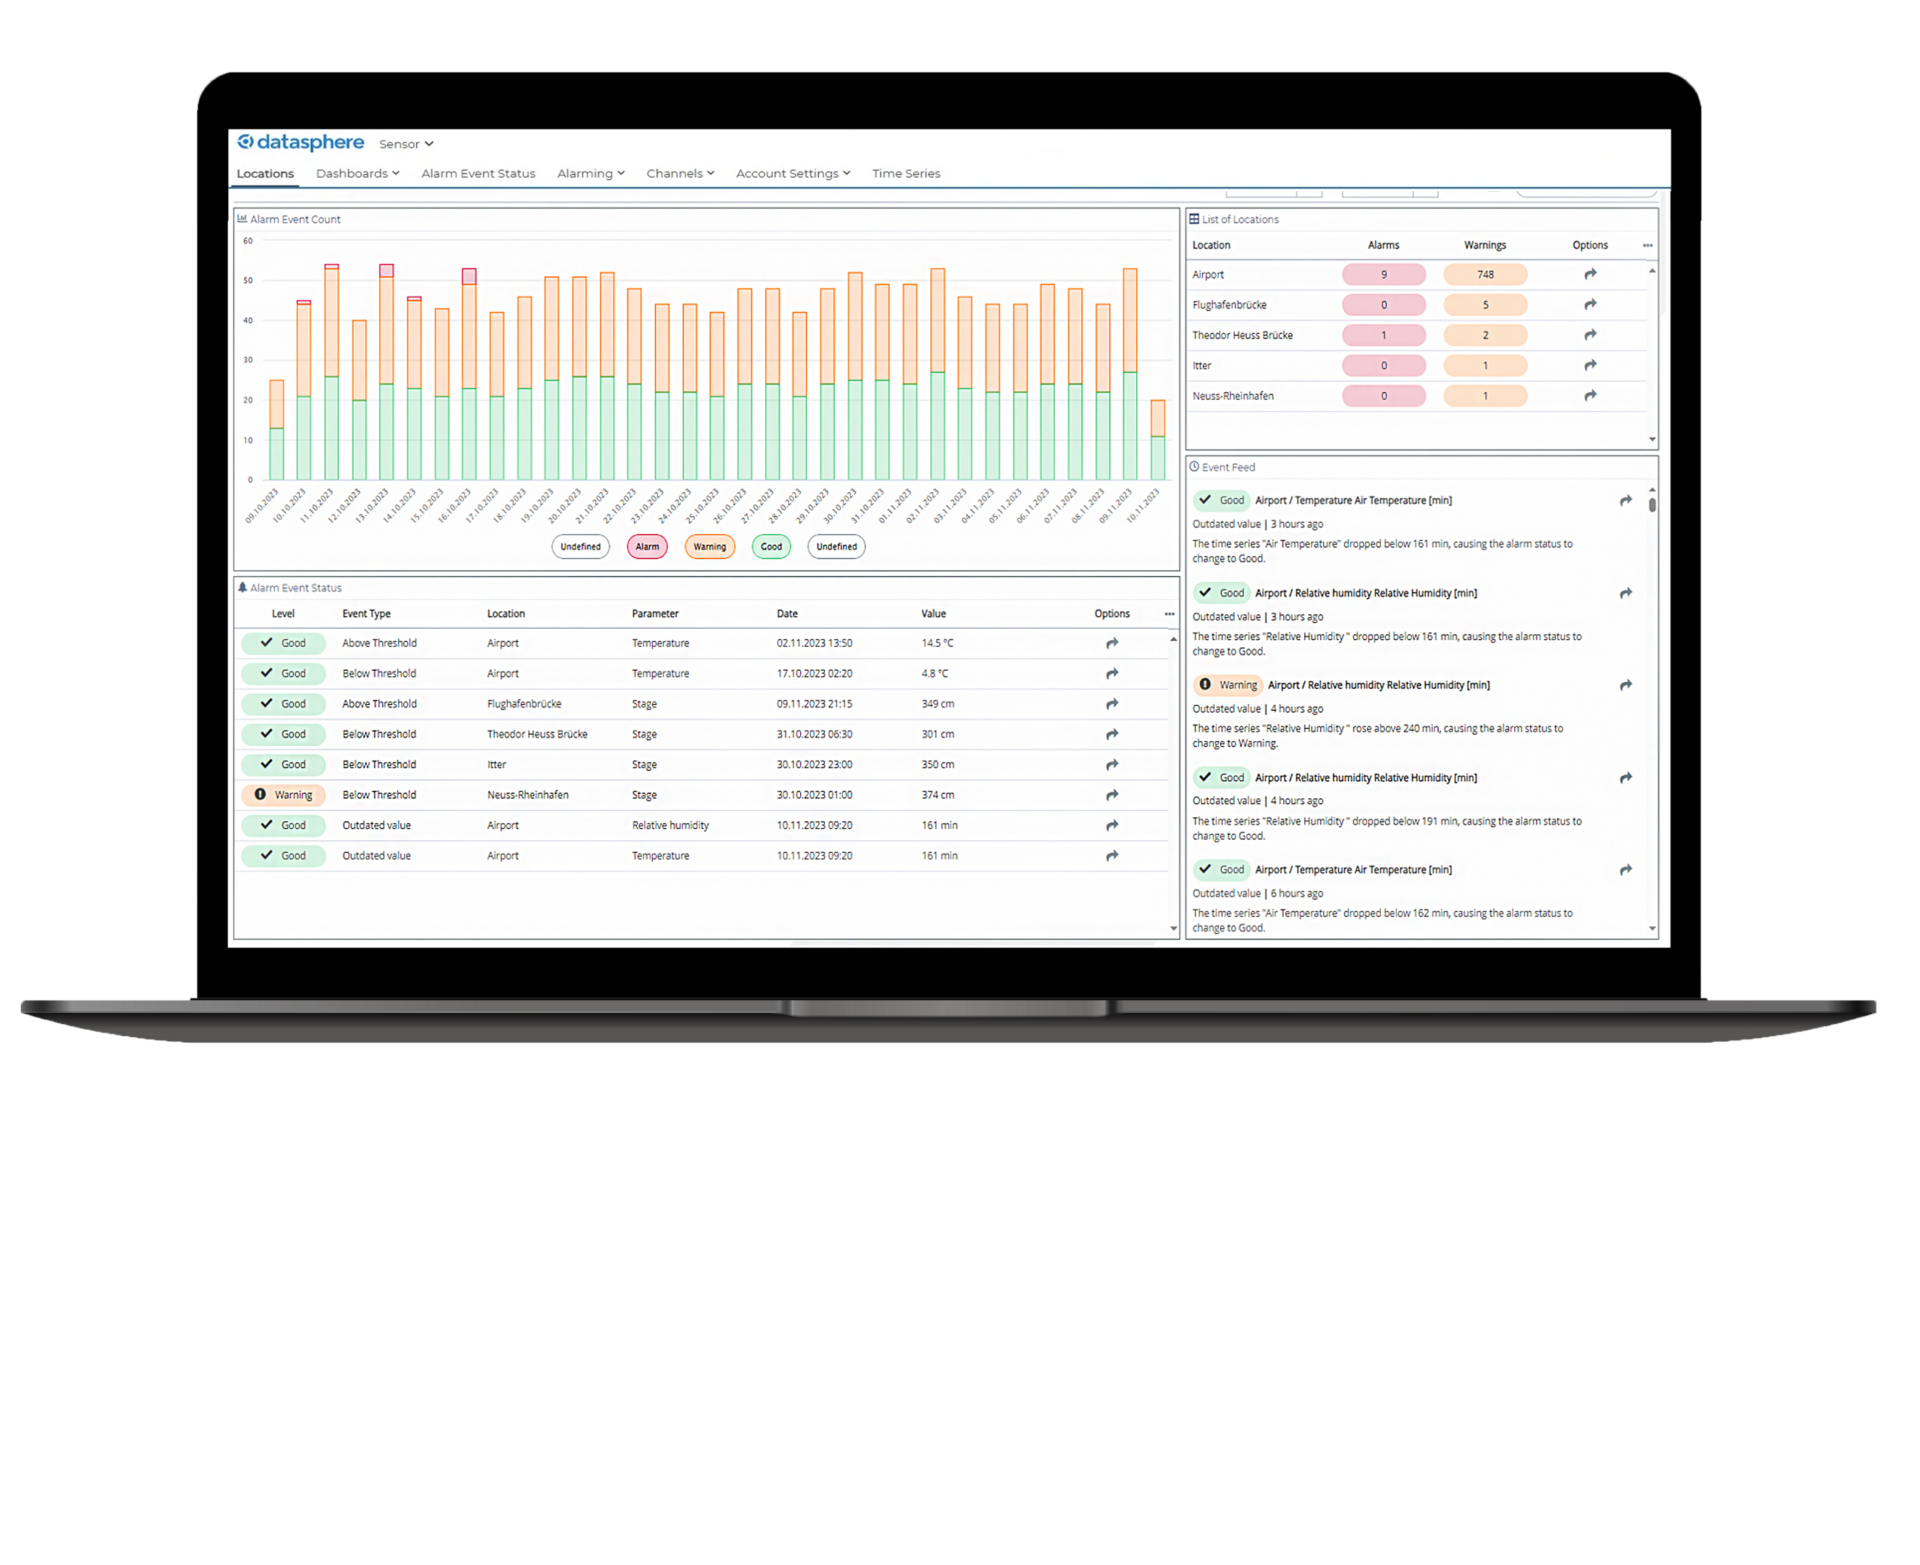
Alarm event count chart – red-amber-green alerts.
Prepare, respond, and assess – with forecasting, nowcasting, and real-time hail measurements.
With Hail Decision Support Solutions

Prepare, respond, and assess – with forecasting, nowcasting, and real-time hail measurements.
Hail Decision Support Solutions
KISTERS datasphere serves as the data backbone for a range of hail solutions — supporting both early warnings and operational response.
See the brochure: Hail Decision Support Solutions Modules Ask about Hail Decision Support Solutions Watch a demo
Choose the solution that fits your needs:
Hail Monitoring Decision Support System
The HailSens360 system includes: HailSens IoT (IoT hail sensor) + software platform + Alarm Module
- Real-time hail measurements from on-site sensor
- Nowcasts with alerts up to 90 minutes before impact for operational response
- Forecasts up to 48 hours ahead for early awareness
- Post-event hail analysis and visualisation
- Powered by KISTERS datasphere
Discover the product Contact us
Early Hail Warning Notification Software
HailSensNow includes: Alarm Module + Hail Warning Software (Forecast and nowcast without sensors)
- Works with any GUI — including KISTERS datasphere
- 48 hr forecasts and 90 min nowcasts
- Hail size prediction and event zone mapping
- Easy-to-integrate alarm module
- Powered by Datasphere
Discover the product Contact us
Learn about an application example of this solution in a story published by the InsuranceNewsNet
Read the storyOther solutions
Post-event hail impact solution— Analysis & assessment
Hail observation solution includes: HailSens IoT (IoT hail sensor)
- Measures hailstone size, intensity, and impact timestamp
- Enables reconstruction of hail events
- Supports damage assessment, prevention planning, and insurance triage
- Standalone hardware — not linked to KISTES datasphere
Learn more about the sensor Contact us
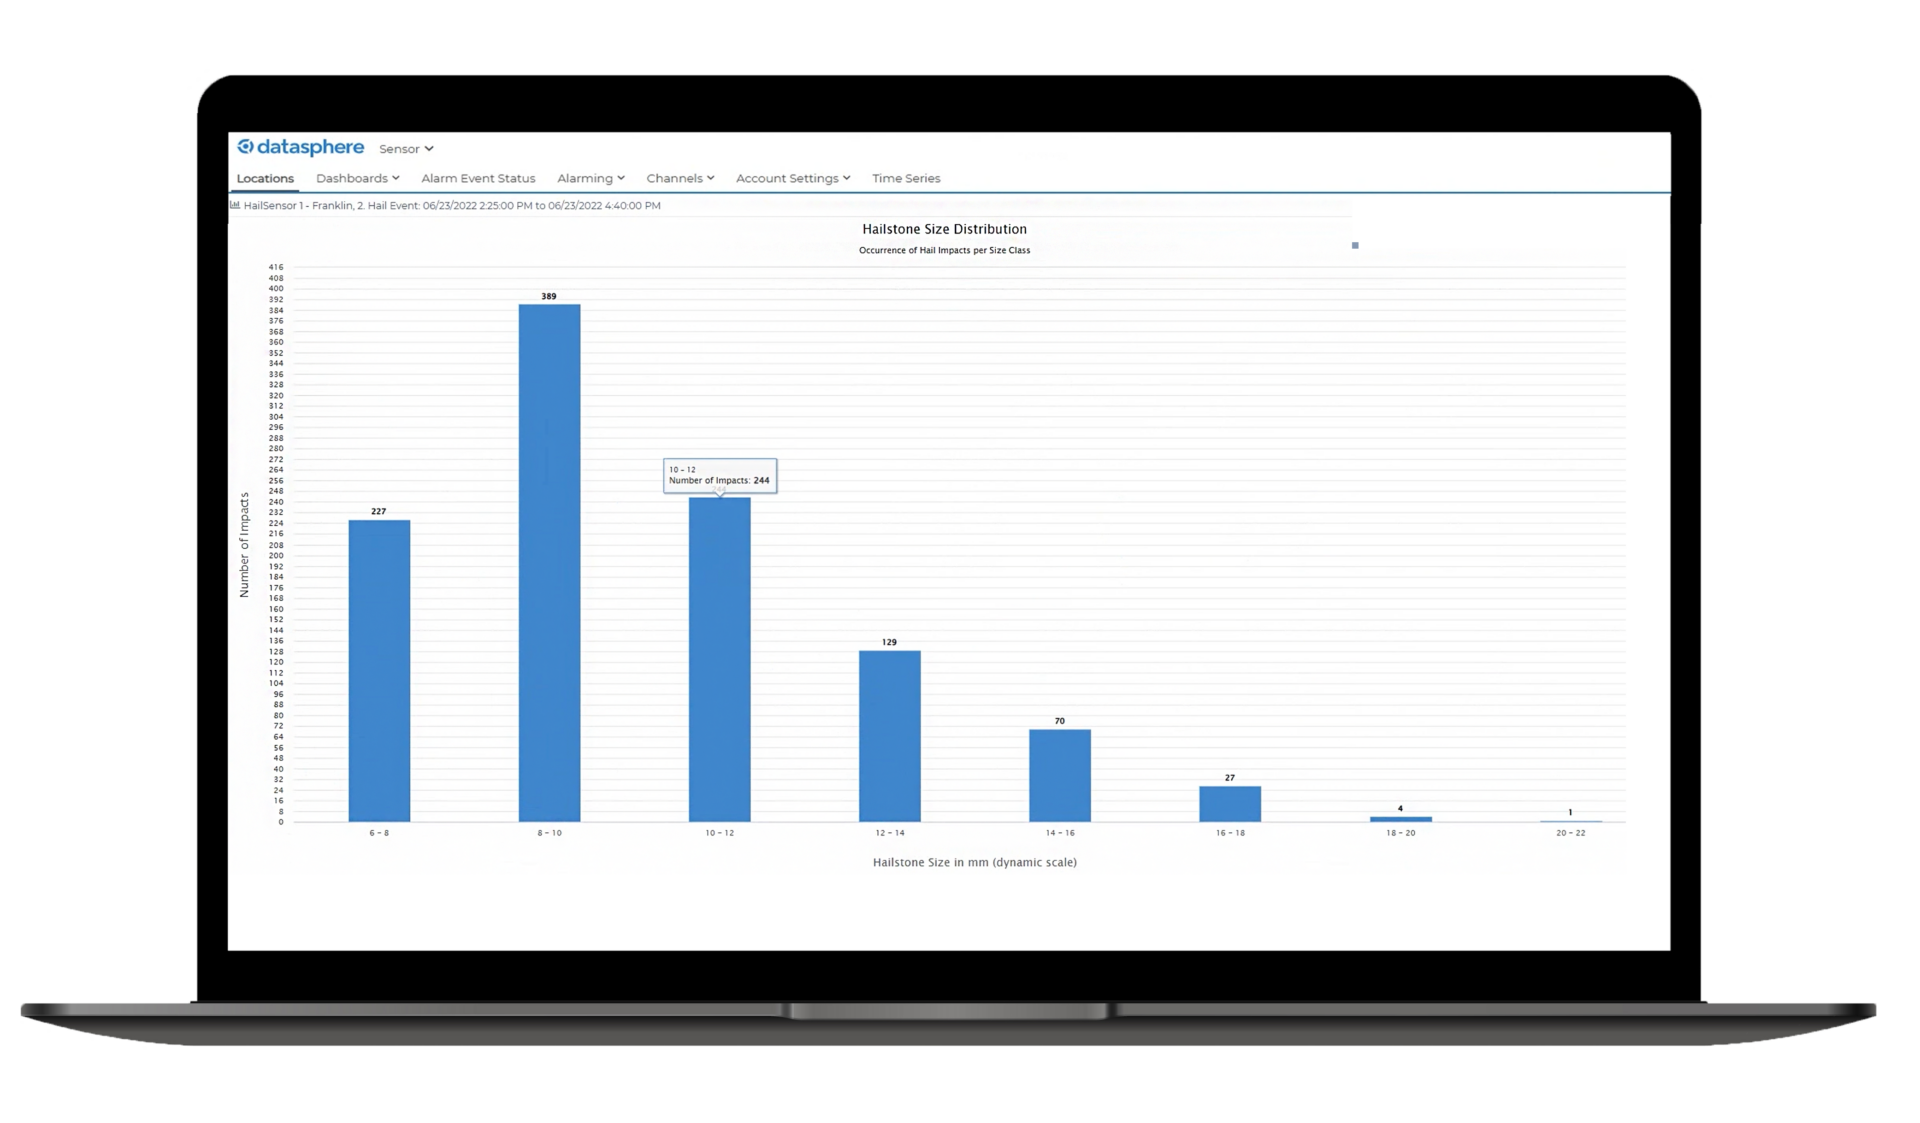
Hail size distribution chart
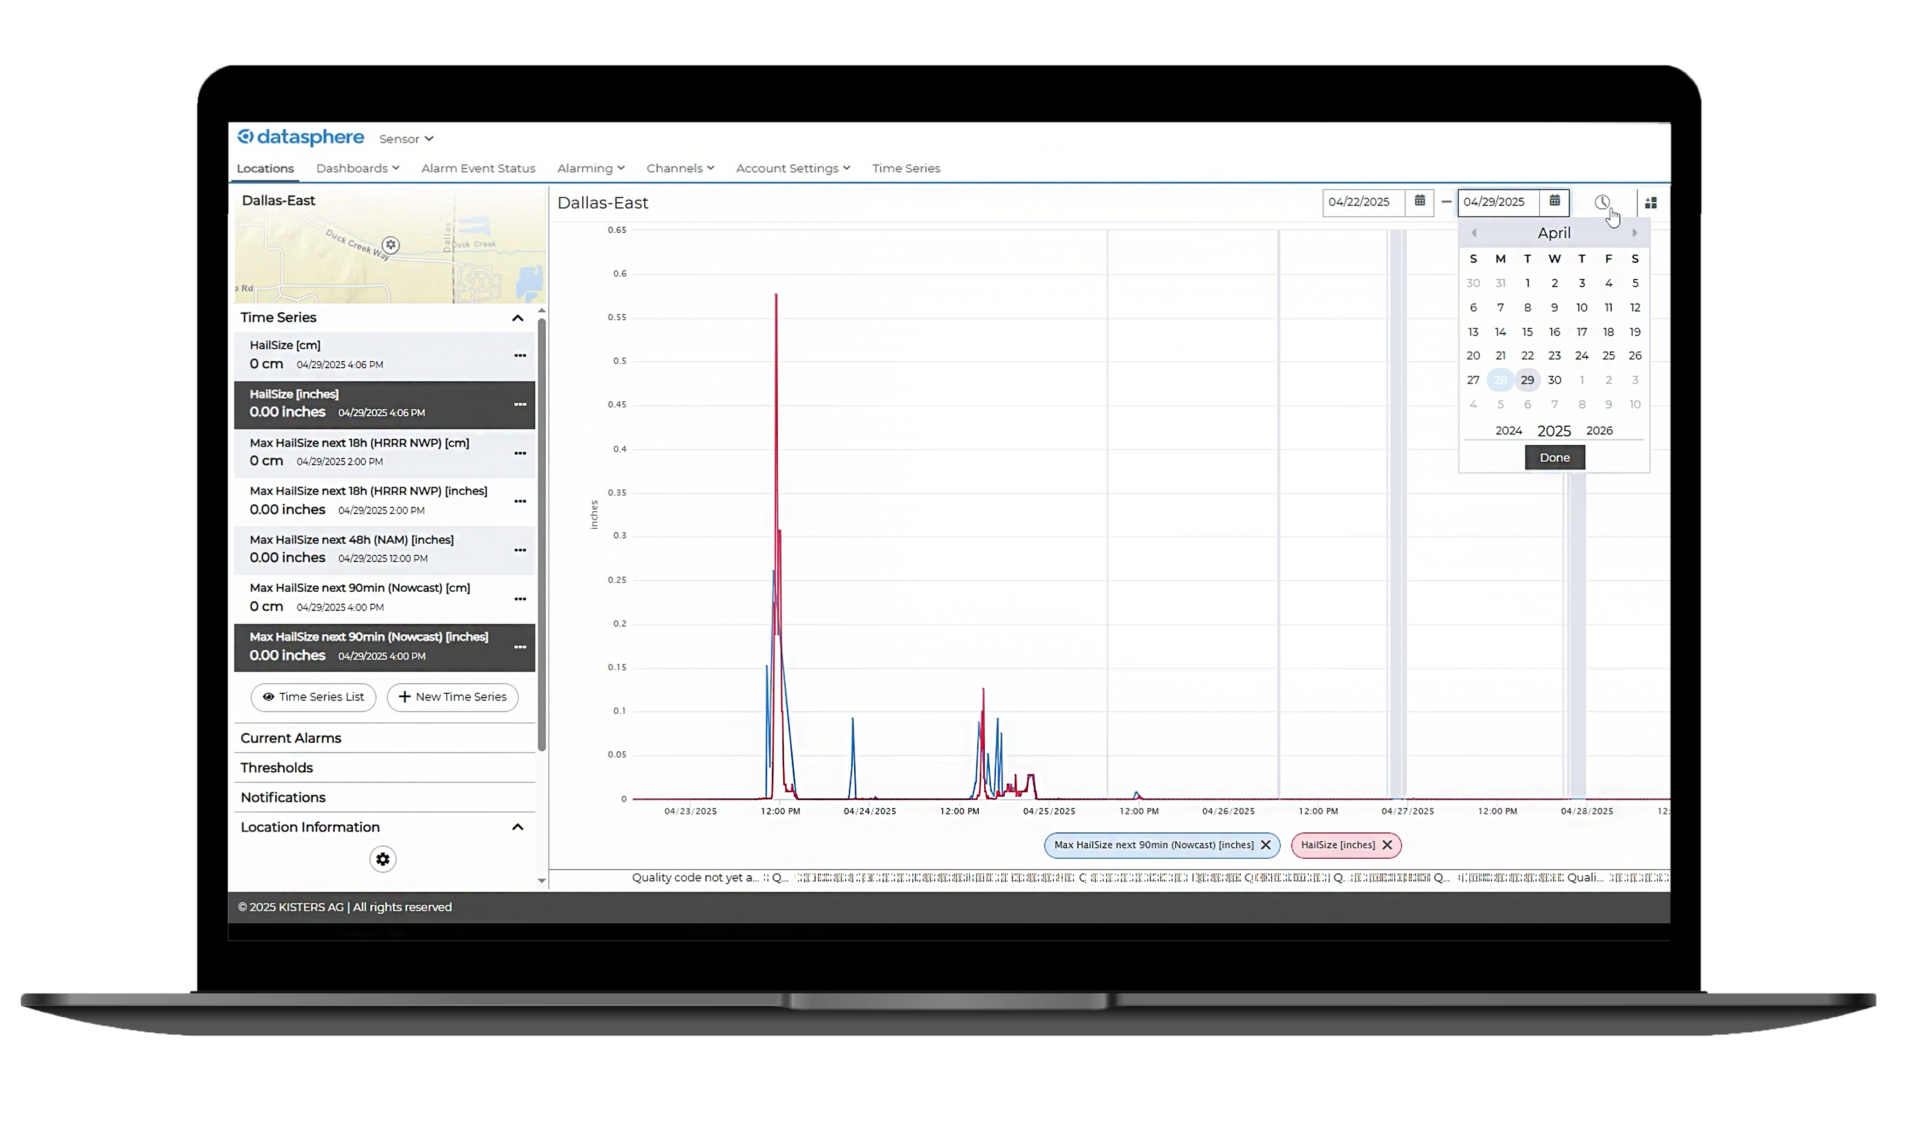
Hail nowcasts (next 90 min) vs sensor observations – chart
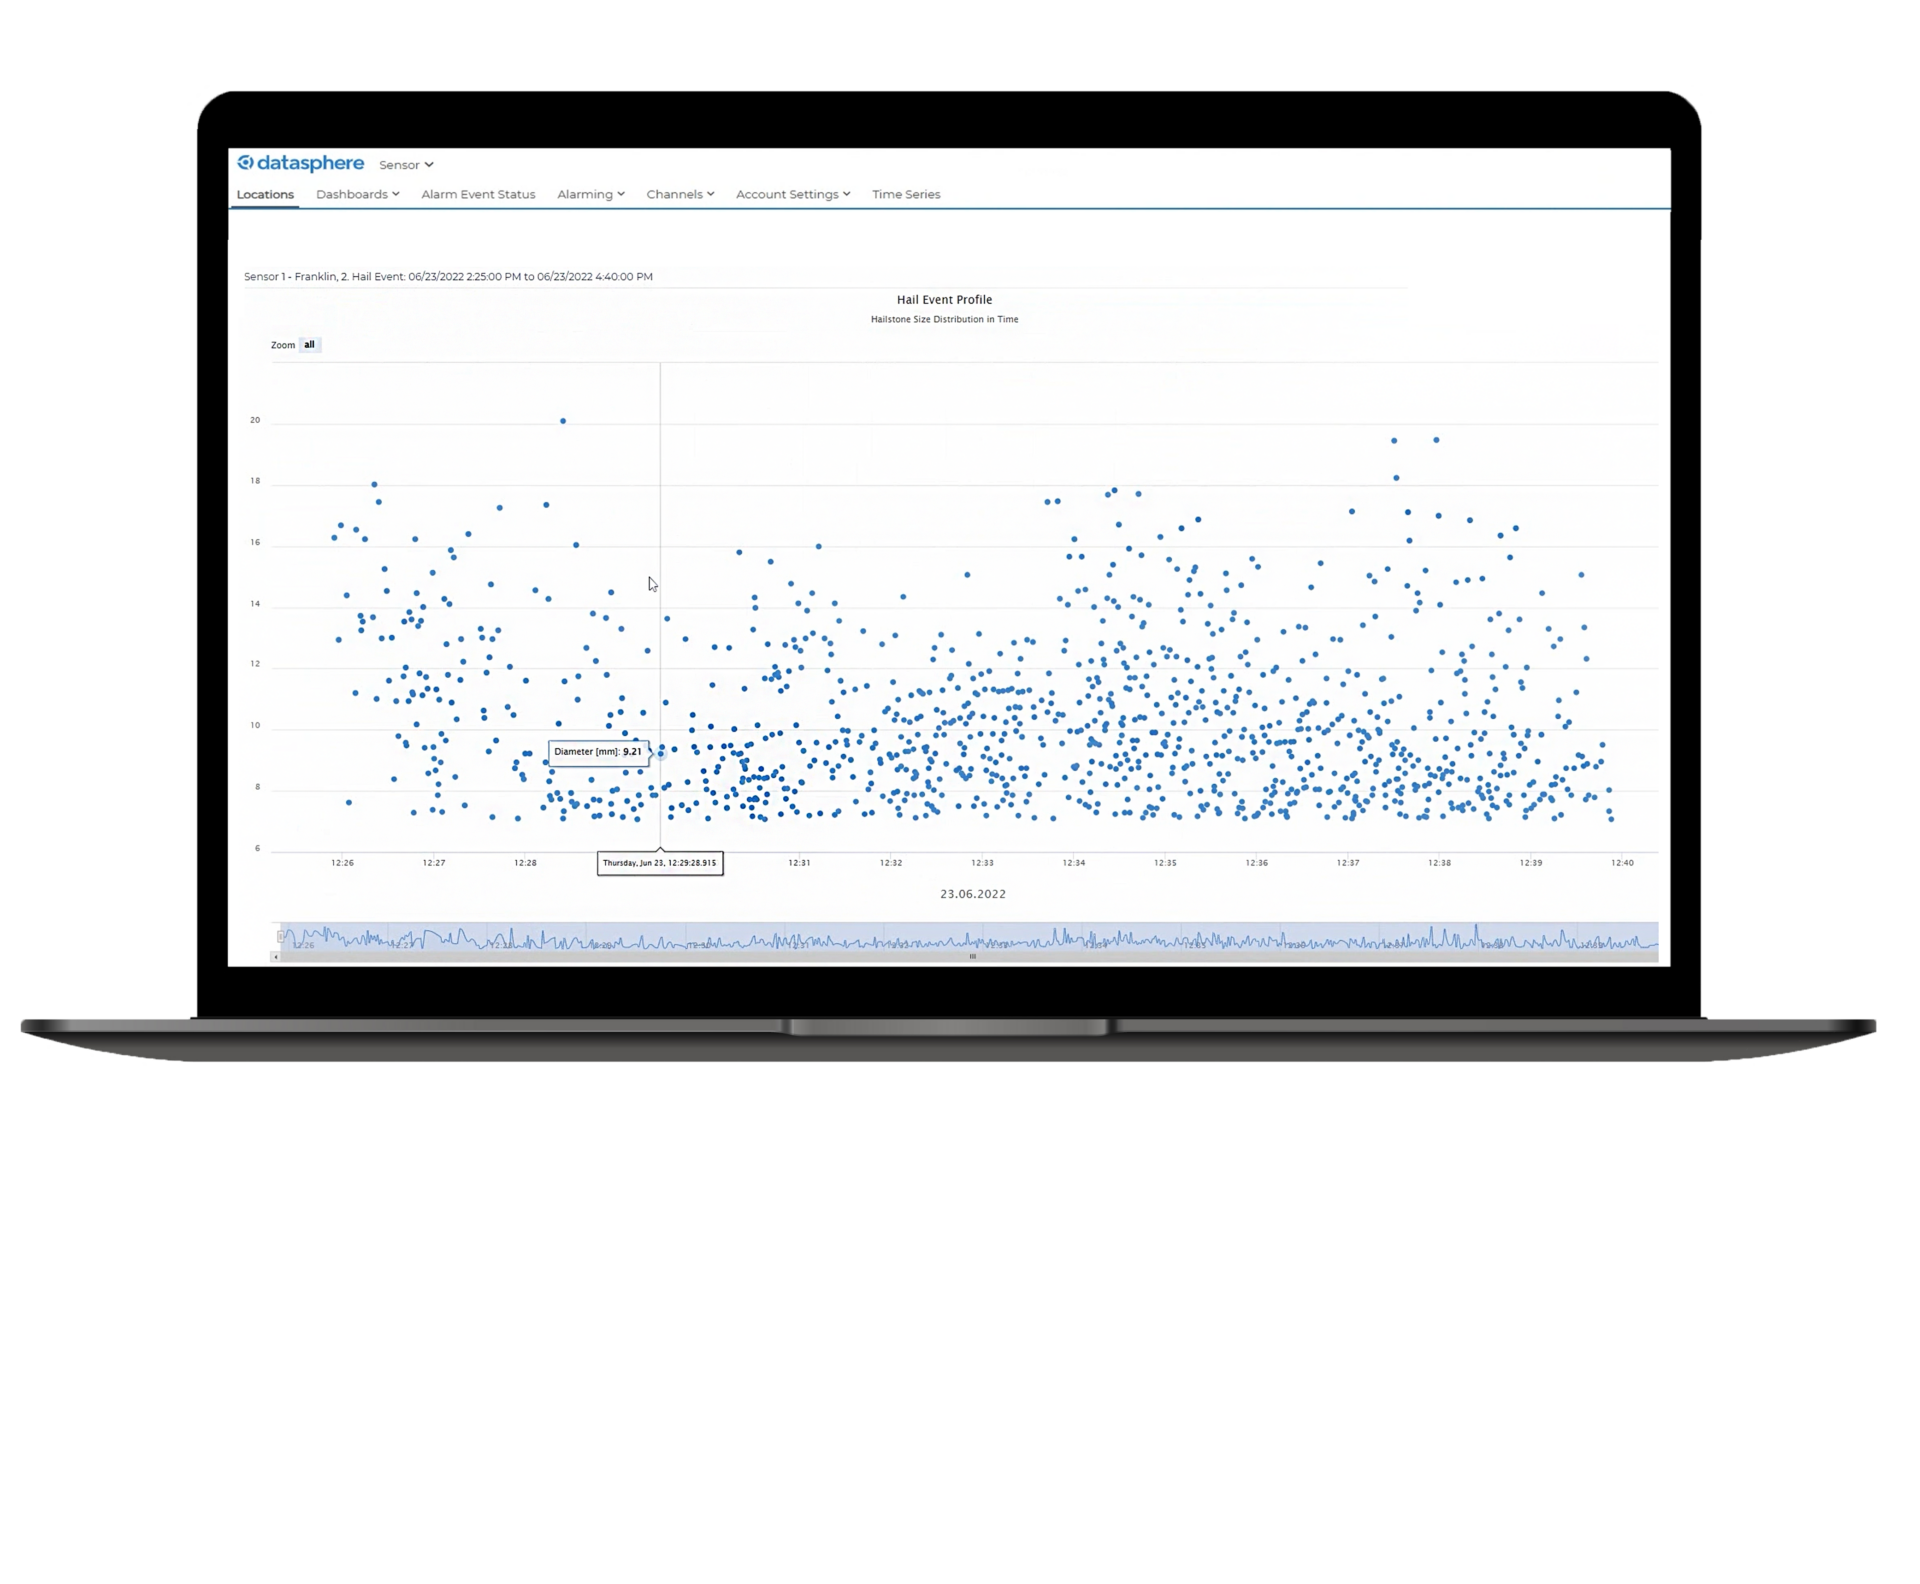
Hail event profile chart
Support early decisions in frost-sensitive areas.
With RoF - Frost Risk Module

Support early decisions in frost-sensitive areas.
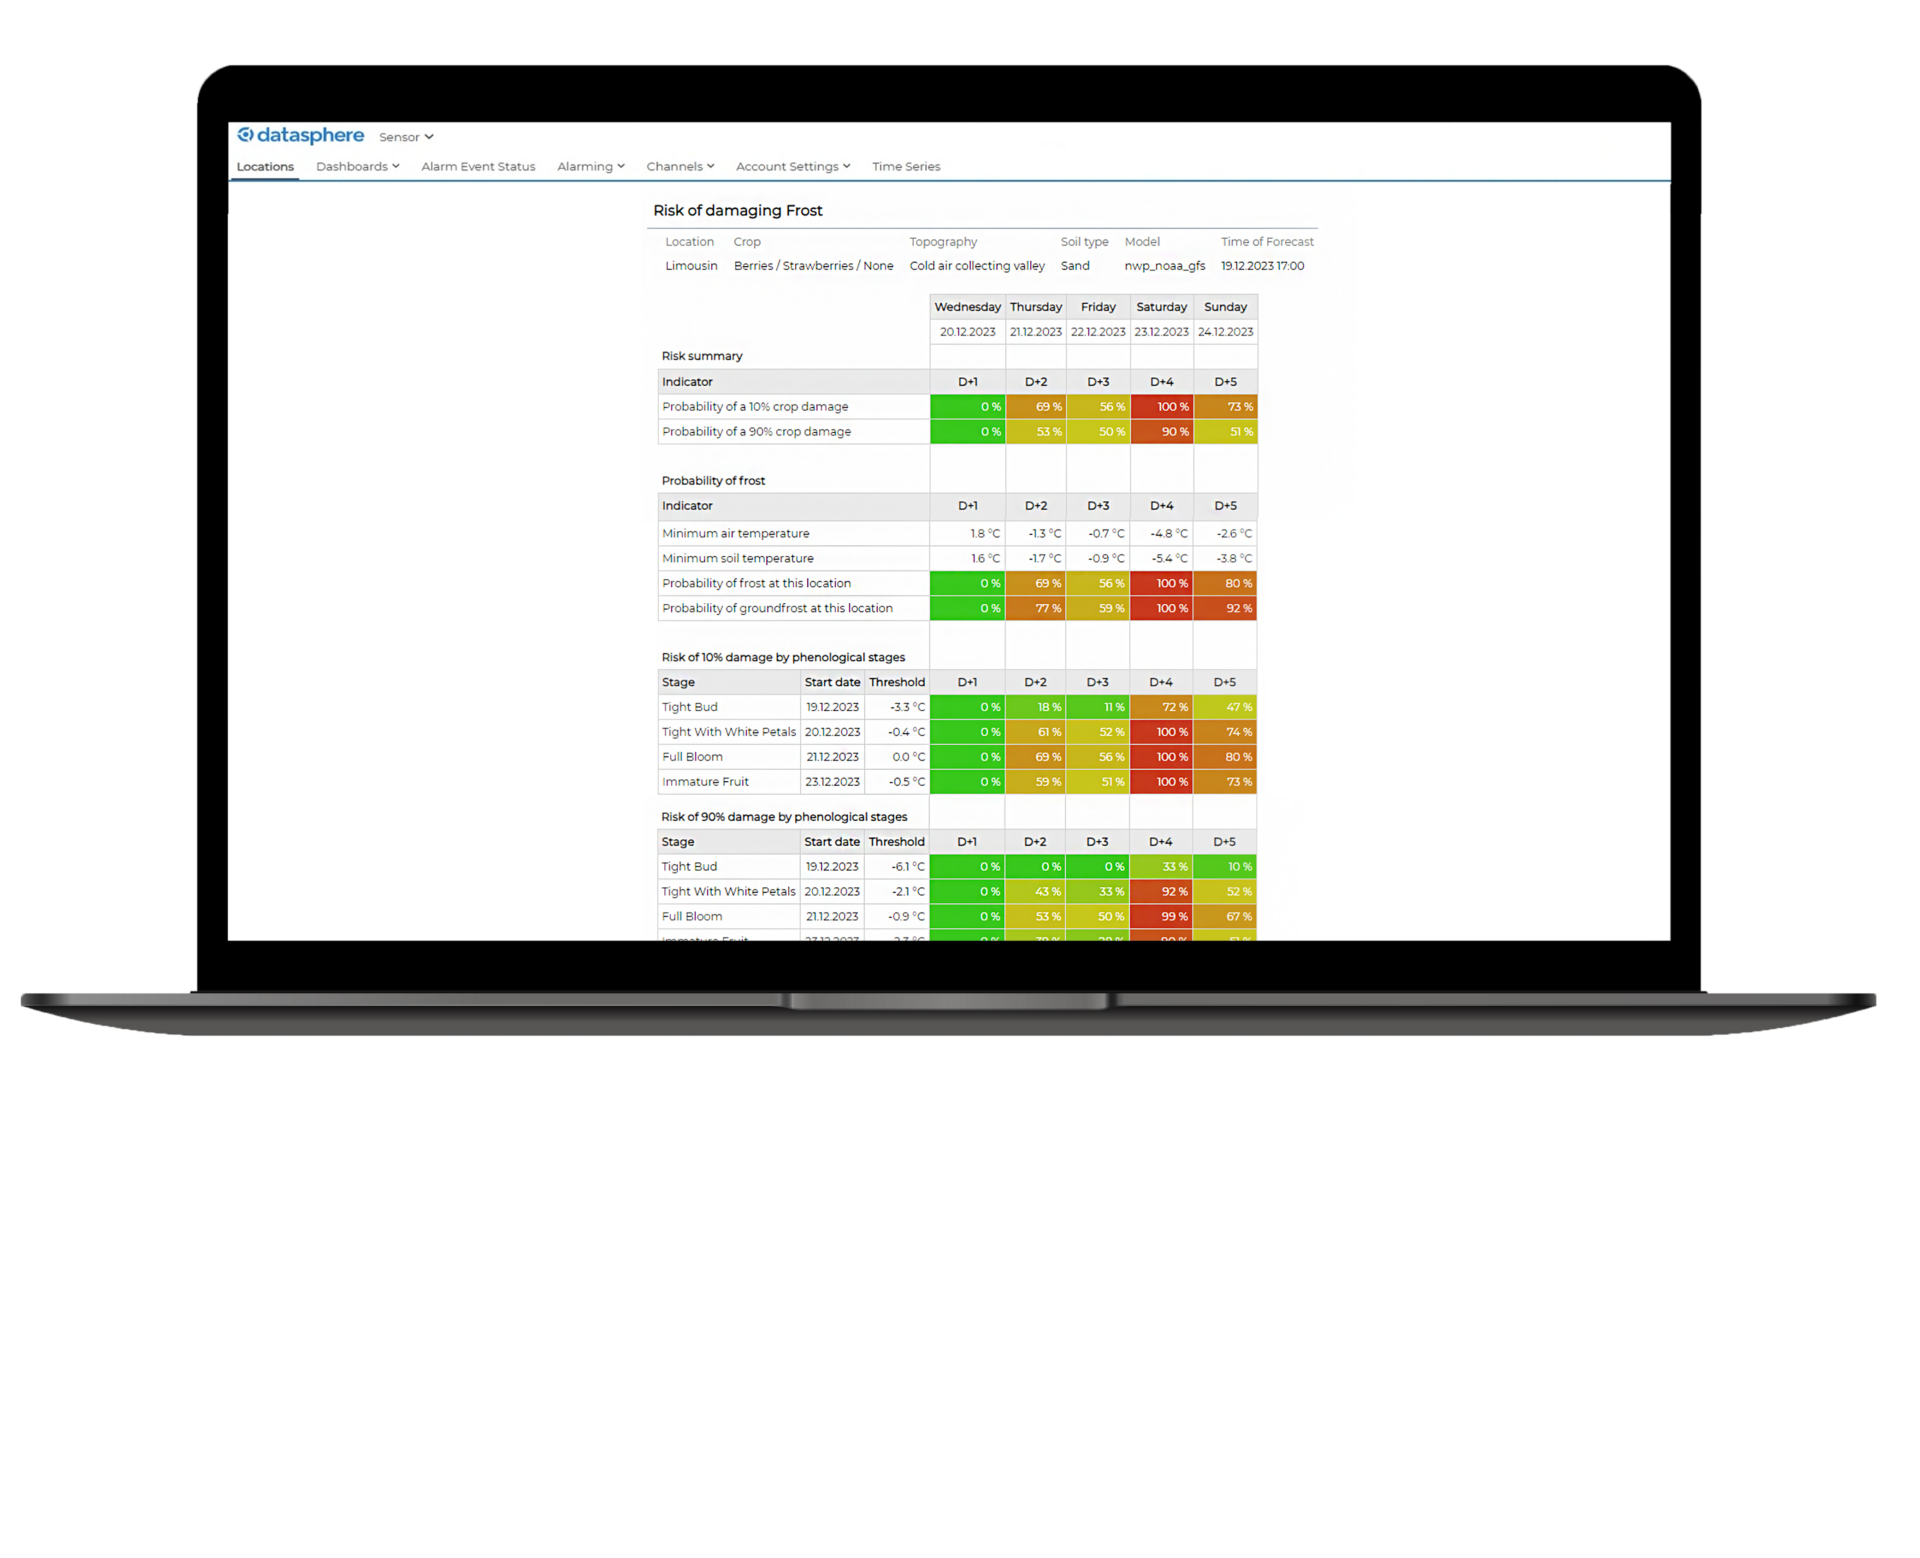
RoF – Frost Risk Module
The frost module provides real-time risk indicators based on hourly forecasts, temperature trends, and expected thresholds.Use it to activate protection systems, or alert stakeholders in time. Protect crops and assets with localized frost forecasts and real-time insights.
- Crop- and growth stage-specific frost thresholds
- Up to 5 days forecasts using regional and global models
- Risk levels visualized by zone and mapped across sensor locations
- Real-time sensor data integration for better decisions
- Adaptable to regional frost thresholds and crop needs
- Powered by KISTERS datasphere
See the product literature Ask about frost protection tools Watch a demo
Risk of damaging frost – probability based on 10% resp 90% damage thresholds reached in a 5-day forecast period
Optimize water use and plant health with automated irrigation insights.
With Irrigation Recommendation Module

Optimize water use and plant health with automated irrigation insights.
Irrigation Recommendation Module
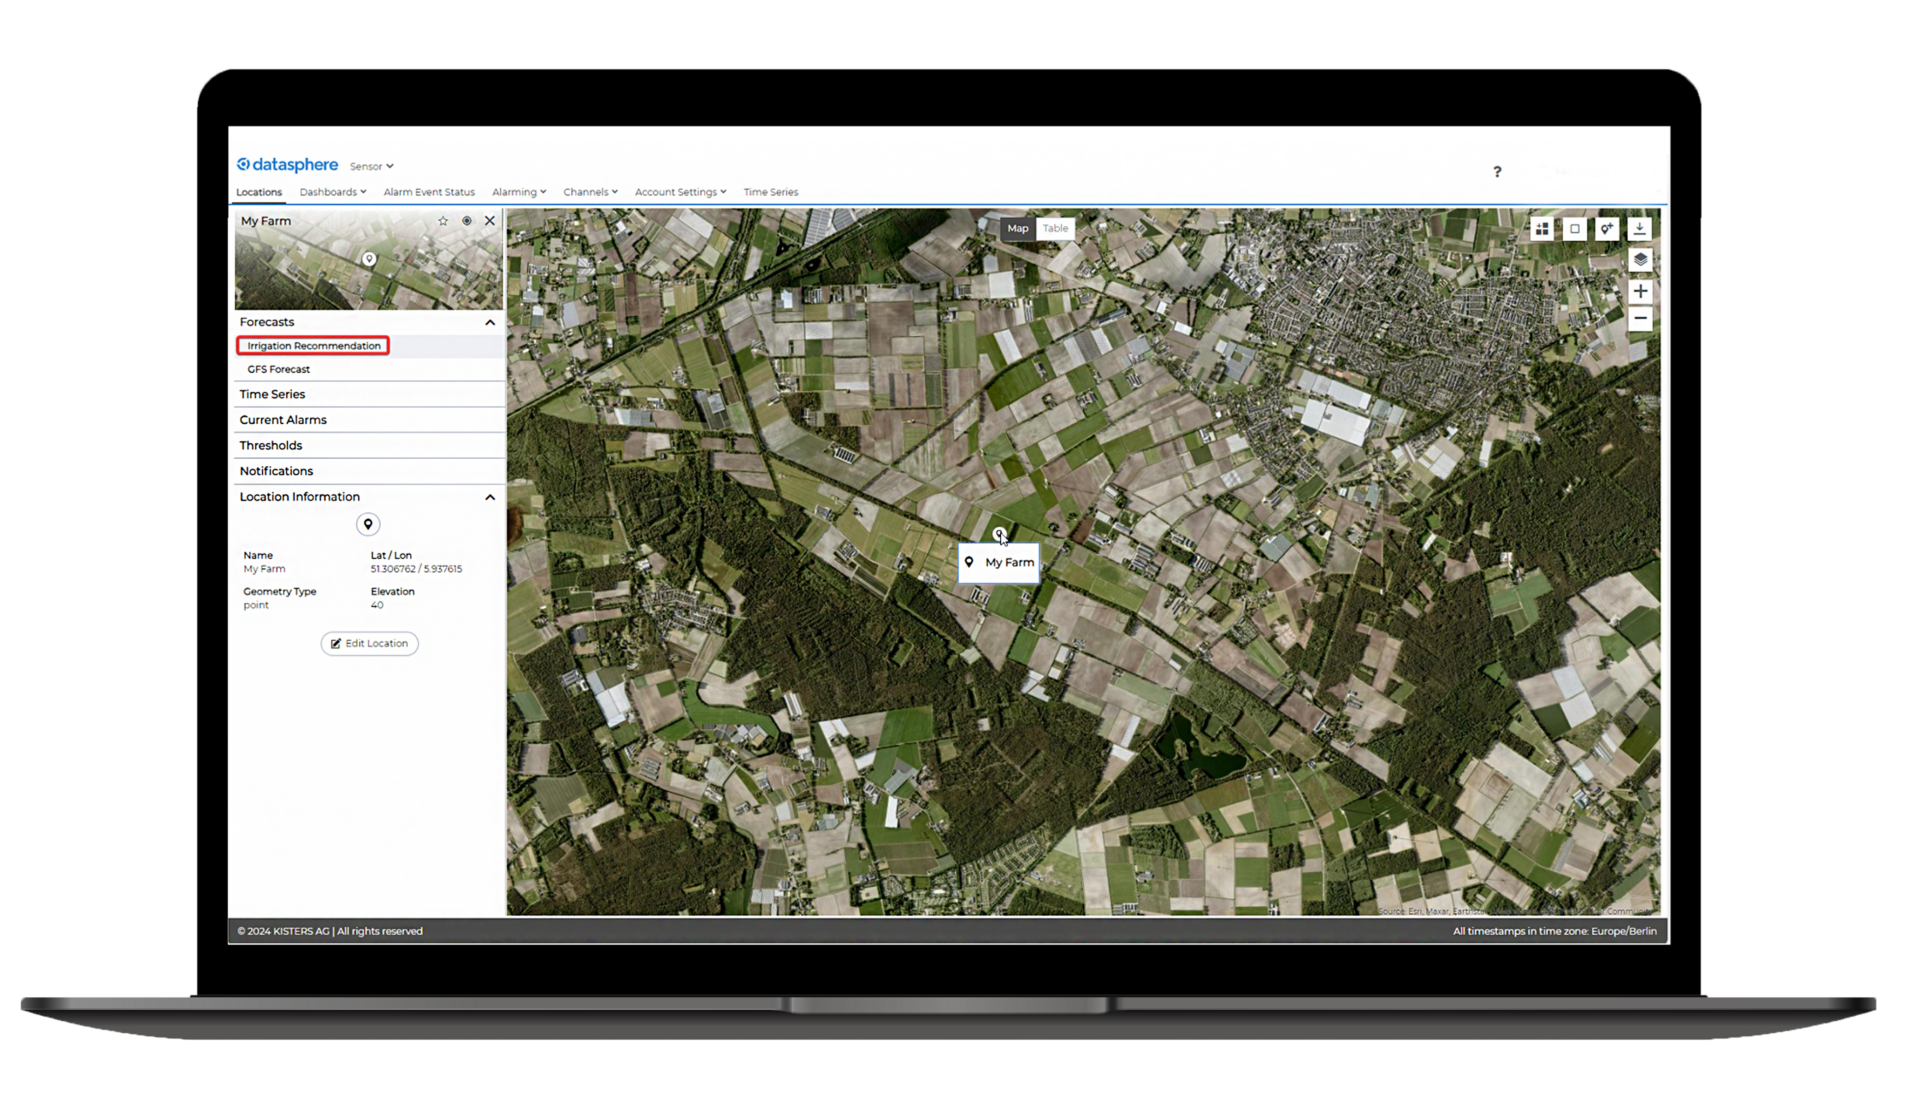
Turn evapotranspiration and precipitation data into action. The irrigation add-on estimates soil moisture conditions and daily crop water needs to support smarter irrigation planning.
- Crop-specific insights
- Based on weather forecasts, soil type, and crop-specific parameters
- ETa-based irrigation forecasts tailored to crop type and soil
- Automatic integration of weather and soil moisture data
- Easy-to-interpret dashboards and irrigation alerts
- Powered by KISTERS datasphere
See the product literature Ask about Irrigation Recommendation Module Watch a demo
Irrigation recommendation GIS view.
 Precipitation forecast and planned gross irrigation chart.
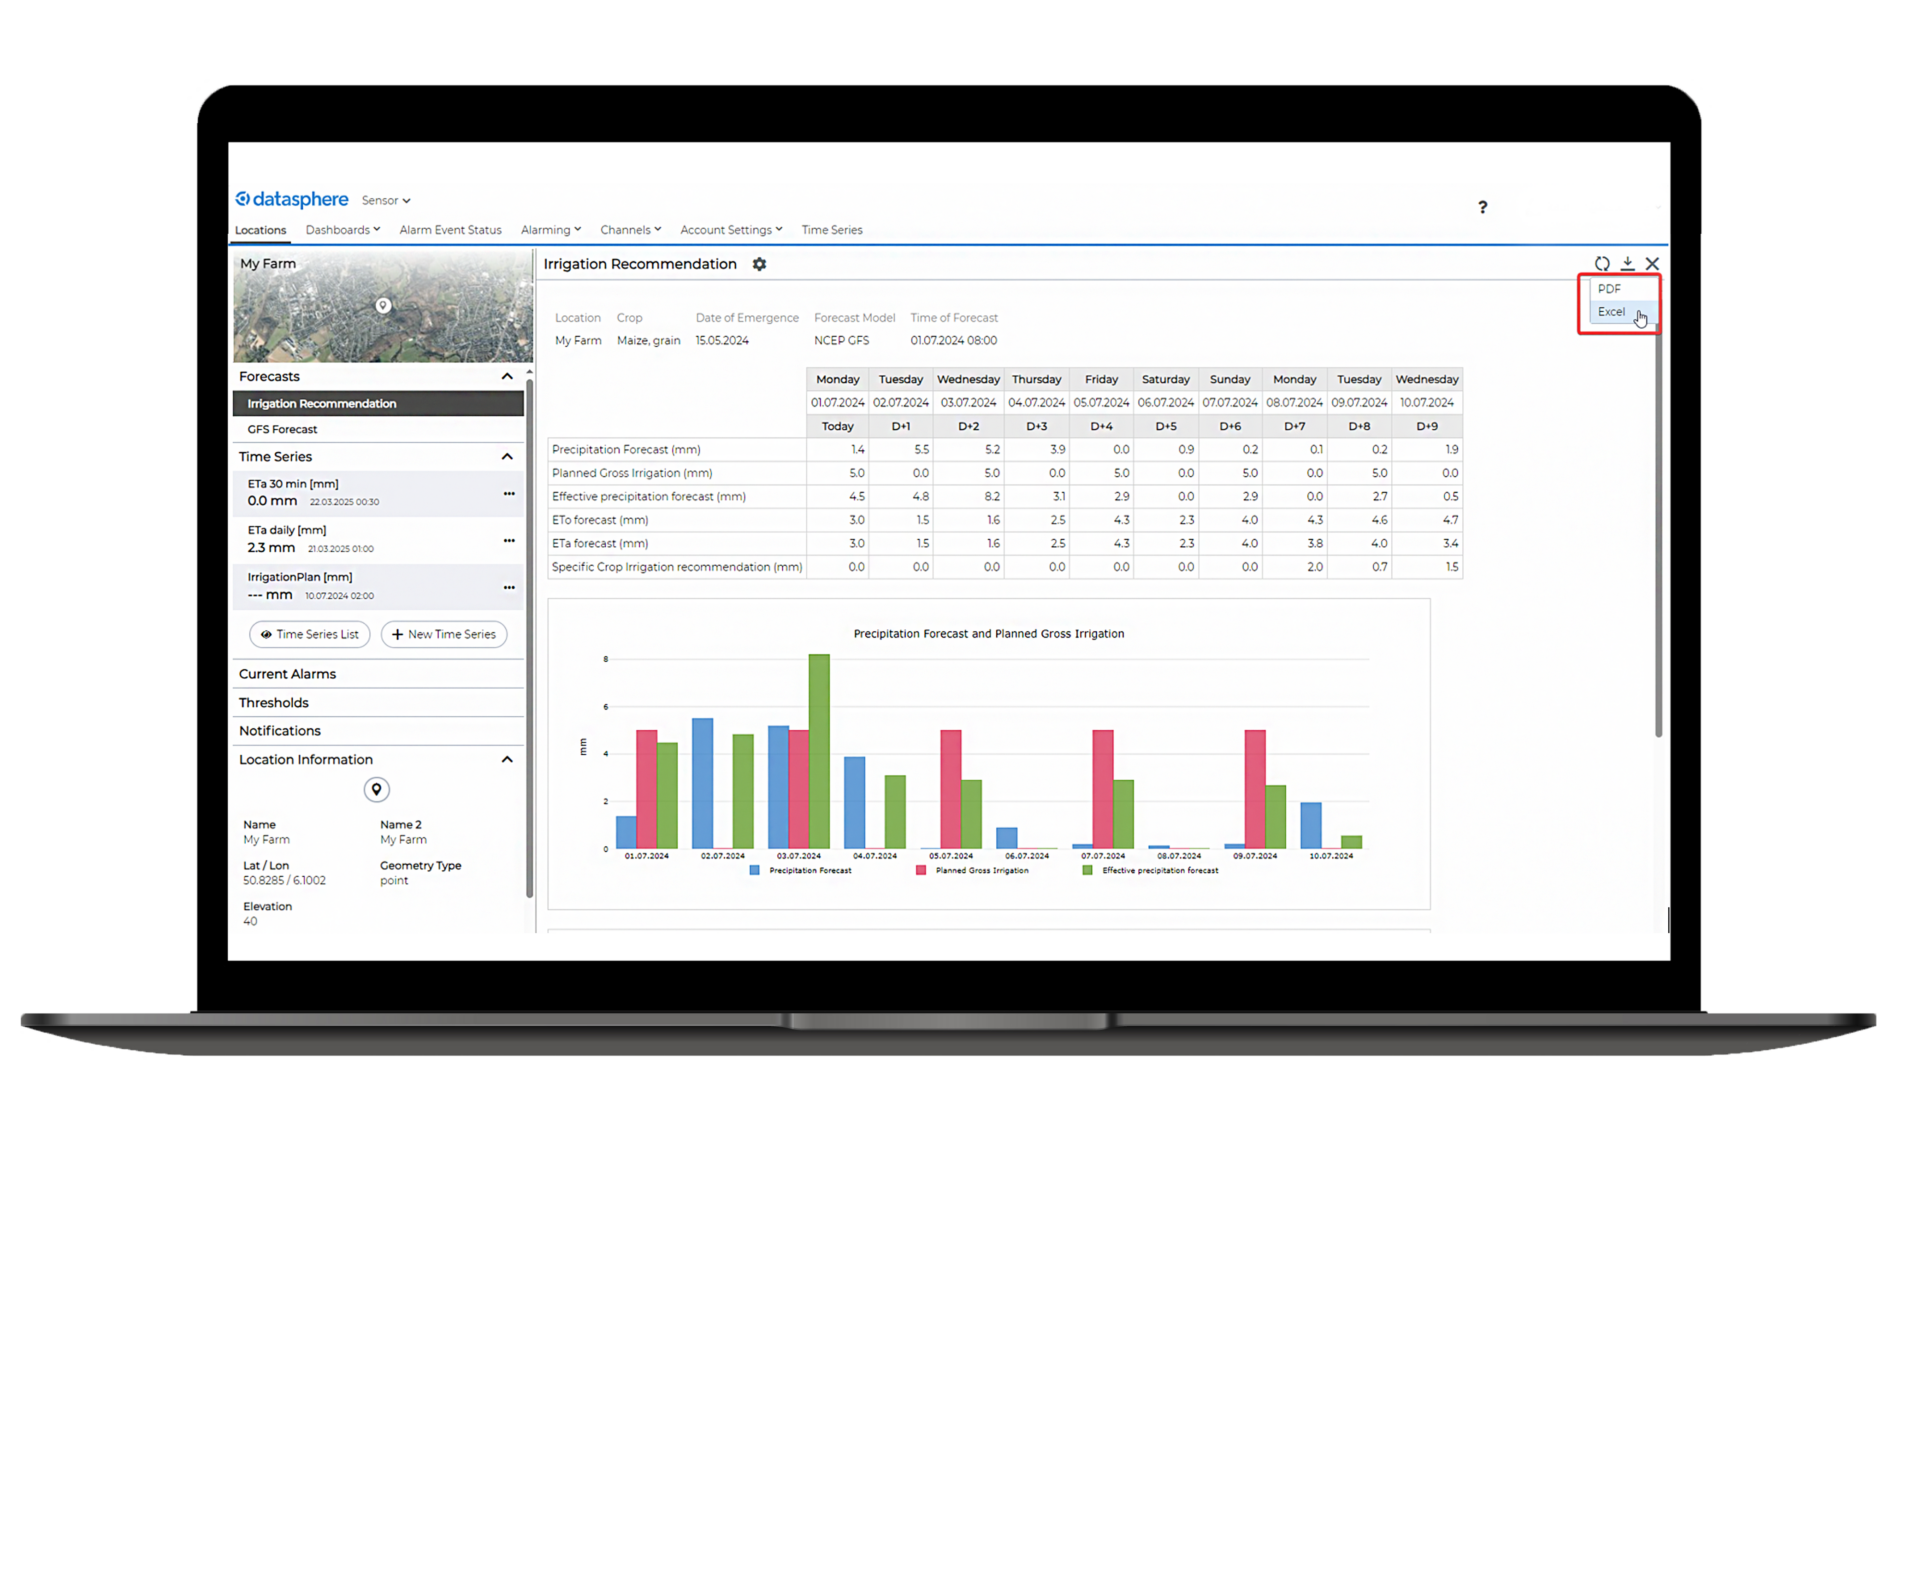
Visualize multiple open data forecasts to better inform your weather-critical operations.
With Raster Viewer Module

Visualize multiple open data forecasts to better inform your weather-critical operations.
Raster Viewer Module
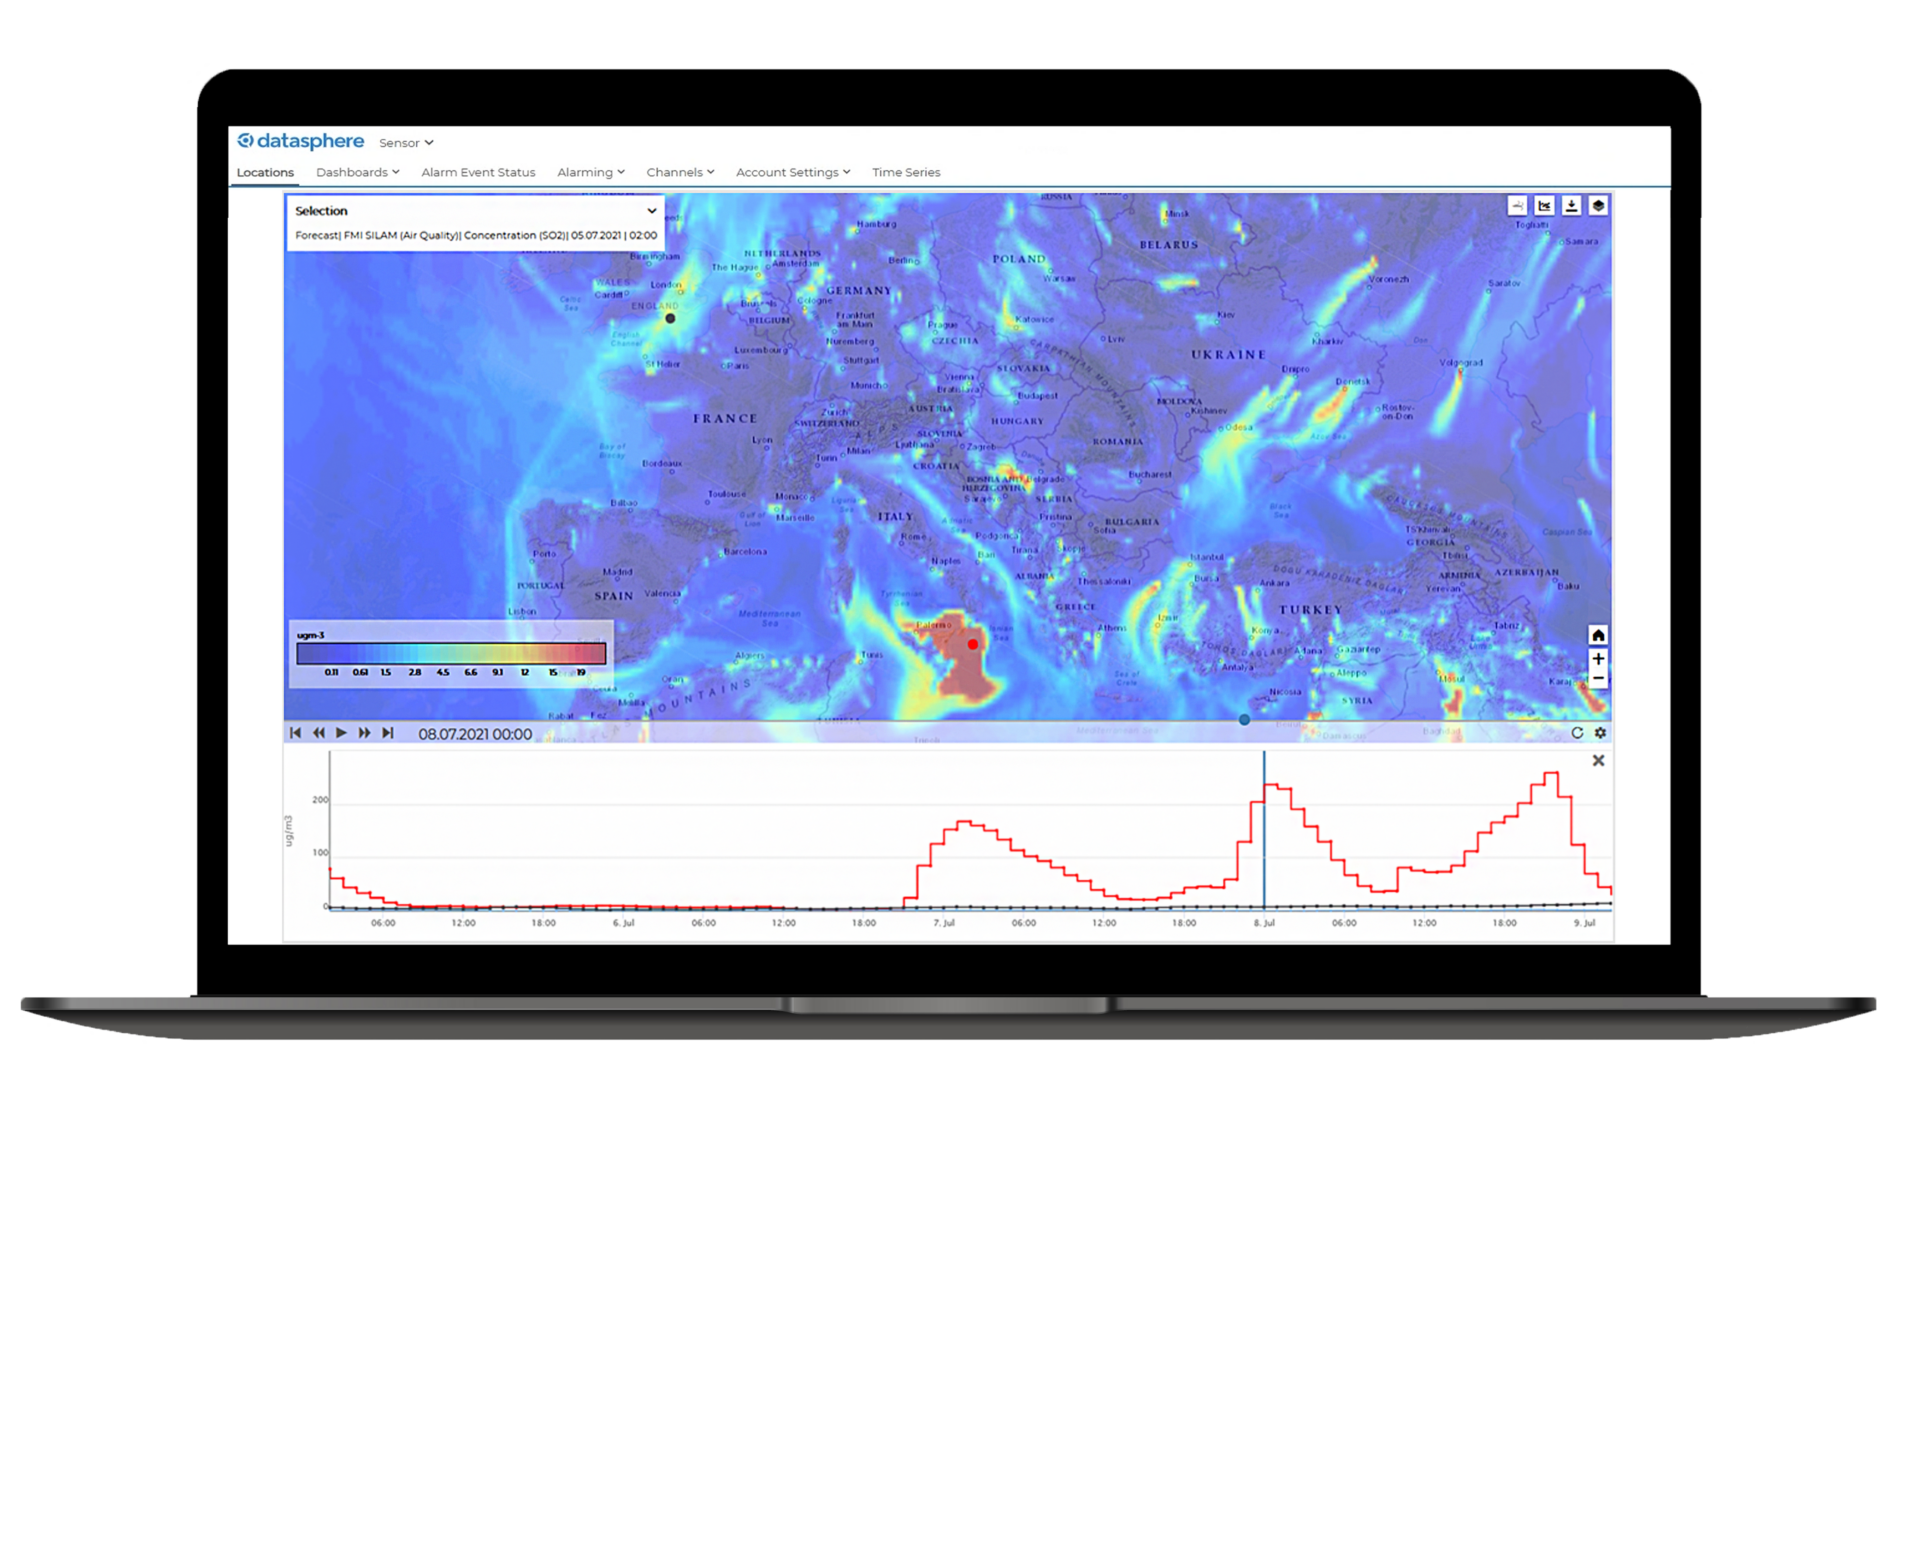
The raster forecast module unlocks more insights from ensemble forecasts and satellite data — helping you better foresee impacts from storms & hail events, temperature shifts, flooding and more.
View these layers in KISTERS datasphere and easily extract timeseries for more weather-resilient operations.
- All powered by KISTERS datasphere.
Ask about Raster Viewer Module Watch a demo
Raster viewer with timeseries extraction.
Securely connect, publish, and automate data flows – without manual work.
With Advanced Data Access, Publishing & Exchange Module

Securely connect, publish, and automate data flows – without manual work.
Advanced Data Access, Publishing & Exchange Module
This module expands KISTERS datasphere’s interoperability, allowing you to automatically import and export data, push to external systems, or access real-time feeds through secure APIs.
Ideal for organizations needing reliable data exchange with internal or third-party platforms.- Automated data import/export via API
- Secure API integration
- Flexible publishing to external databases or endpoints
- Reduces manual file handling and errors
- Supports transparency, regulatory reporting, or third-party sharing
- Powered by KISTERS datasphere
Ask about Advanced Data Access, Publishing & Exchange Module Watch a demo
QA/QC error connection review
Learn more about KISTERS datasphere.

Customer Success Story: England’s Most Digitally Connected Water Catchment.
Six agencies, one vision: The Blue Heart project in East Sussex, England uses KISTERS Datasphere to unite 495+ live sensors, cross-agency data sharing, and automated flood alerts. It’s setting a new benchmark for water resilience in the UK.
Customer Success Story: Hillingdon Lighthouse: Smarter Flood Response in England.
In Hillingdon, England, KISTERS datasphere delivers real-time rainfall and water level insights. Accurate forecasts and live data empower faster decisions, better resource allocation, and stronger community resilience.
Read the Hillingdon Case StudyFAQs.
What is KISTERS datasphere in a nutshell?
KISTERS datasphere is a cloud-based platform for centralizing, monitoring, and analyzing environmental data. It brings together real-time, recent, historical, and forecast data — with intuitive dashboards, customizable alerts, and powerful visualization tools — helping you transform raw data into actionable insight.
What kind of data can KISTERS datasphere integrate?
KISTERS datasphere acts as a central hub for real-time sensors, data loggers, weather raster data, camera imagery, and open or commercial sources. It lets users visualize trends, overlay multiple datasets, and monitor multiple locations side-by-side — all in one platform.
What features does KISTERS datasphere offer for analysis and collaboration?
KISTERS datasphere includes customizable dashboards, graph overlays, color coded threshold alerts, historical data, basic statistics (min, mean, max), dynamic logging, and GIS-based map visualization. Optional add-on modules extend capabilities with forecasting, advanced alerting, and automated data publishing.
Related products
Hail monitoring and
decision support

HailSens360 brings together real-time sensor data, nowcasts, and hail forecasts to deliver a complete view of storm activity — including hailstone size, impact intensity, and storm direction. Visualize everything through interactive dashboards in KISTERS datasphere and help your team act faster, with clearer priorities.
Smart irrigation monitoring
for better farming

FieldRay is an all-in-one irrigation monitoring system that was designed for the modern grower.
By combining IoT sensors, weather and soil moisture data, and easy-to-use software powered by KISTERS datasphere, it gives farmers real-time insights to optimize water use, crop health, and resource efficiency.
Support operators with
hail warning alerts

Deliver hail alerts powered by KISTERS datasphere to support operators, maintenance teams, and public works crews through intelligent nowcasts 60–90 minutes before a storm. Texts or emails will help your team members fulfill protocols to reduce hail risk. The early warning system provides your team with decision support that goes beyond general weather data.